
Dataset: CARICOM Countries – GDP per Capita (Current EC$) in Current Market Prices
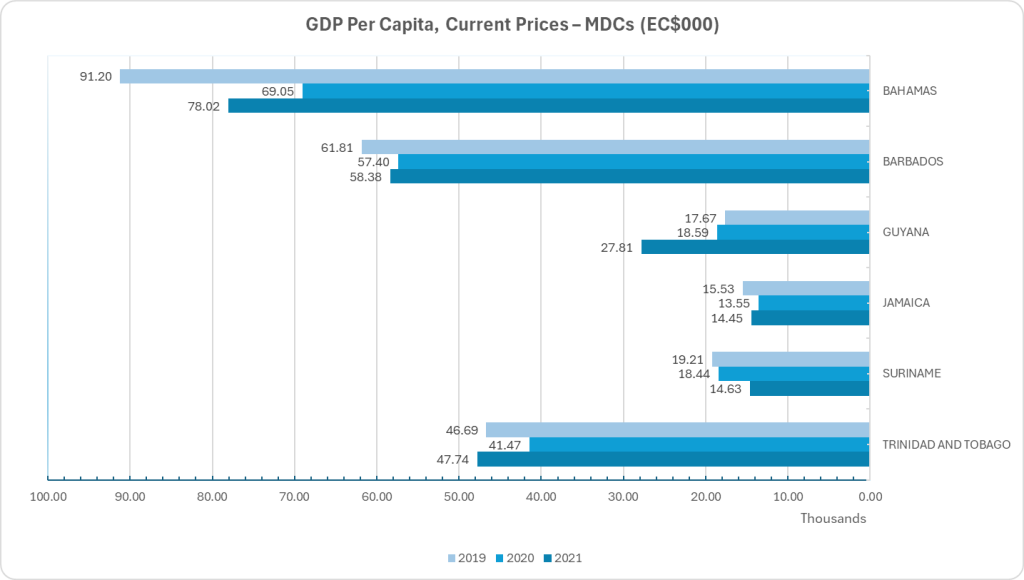
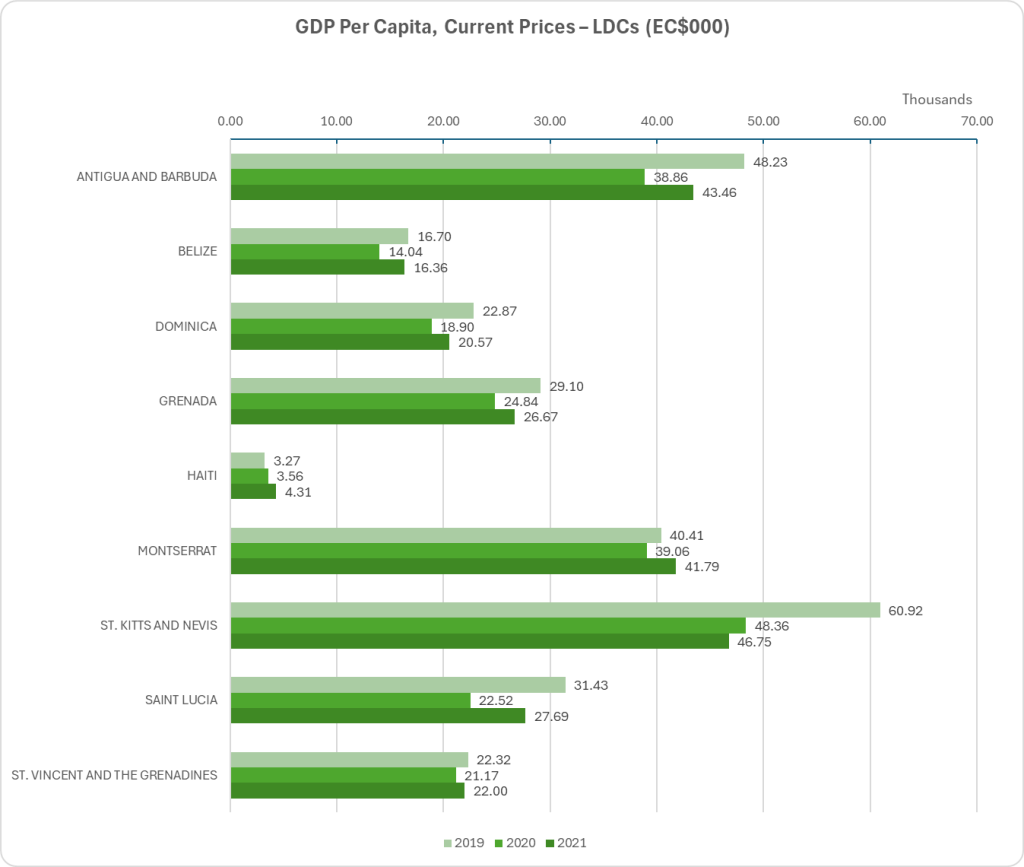
CARICOM's GDP per capita (Current Prices EC$)-All Countries
This indicator is expressed in current prices, meaning no adjustment has been made to account for price changes over time. This indicator is expressed in Eastern Caribbean dollars| COUNTRY | 2018 R | 2019 R | 2020 R | 2021 R |
|---|---|---|---|---|
| 0-CARIBBEAN COMMUNITY | 15,573.2 | 15,477.6 | 13,928.2 | 15,676.3 |
| 1-MEMBER STATES | 13,480.3 | 13,279.9 | 11,960.4 | 13,536.1 |
| ANTIGUA AND BARBUDA | 47,117.5 | 48,229.2 | 38,855.0 | 43,459.5 |
| BAHAMAS | 89,328.4 | 91,201.8 | 69,045.7 | 78,017.5 |
| BARBADOS | 57,230.1 | 61,806.2 | 57,395.4 | 58,377.1 |
| BELIZE | 16,347.1 | 16,700.7 | 14,035.0 | 16,364.4 |
| DOMINICA | 24,381.6 | 24,092.8 | 19,728.2 | 20,852.0 |
| GRENADA | 28,131.6 | 29,102.9 | 24,838.7 | 26,667.2 |
| GUYANA | 16,943.8 | 17,673.3 | 18,591.4 | 27,810.7 |
| HAITI | 3,743.0 | 3,271.0 | 3,561.9 | 4,311.0 |
| JAMAICA | 15,450.6 | 15,527.6 | 13,550.2 | 14,448.5 |
| MONTSERRAT | 37,390.2 | 40,407.2 | 39,061.8 | 41,790.0 |
| ST. KITTS AND NEVIS | 59,514.3 | 60,919.3 | 48,363.6 | 46,746.1 |
| SAINT LUCIA | 31,140.0 | 31,431.4 | 22,521.4 | 27,688.3 |
| ST. VINCENT AND THE GRENADINES | 21,721.0 | 22,319.1 | 21,167.8 | 21,997.2 |
| SURINAME | 18,284.2 | 19,210.7 | 18,442.4 | 14,627.9 |
| TRINIDAD AND TOBAGO | 47,553.4 | 46,685.6 | 41,473.4 | 47,743.5 |
| 2-ASSOCIATE MEMBERS | 191,254.0 | 196,504.8 | 180,172.1 | 192,354.3 |
| ANGUILLA | 55,510.8 | 65,709.5 | 45,452.8 | 52,487.1 |
| BERMUDA | 305,245.9 | 313,637.2 | 291,102.2 | 309,249.3 |
| BRITISH VIRGIN ISLANDS | 111,532.9 | 119,705.6 | 111,845.6 | 116,702.9 |
| CAYMAN ISLANDS | 227,763.5 | 230,410.2 | 233,049.6 | 231,080.2 |
| TURKS AND CAICOS ISLANDS | 72,653.4 | 76,725.7 | 42,191.6 | 75,940.3 |
| Source: Compiled from official national data sources | ||||
| Revised: August 2025 Note: R-Revised data |
||||
Figures are rounded to the nearest hundred and expressed in thousands (EC$000)
Figures are rounded to the nearest hundred and expressed in thousands (EC$000)