About the 2020 Census Round
The 2020 Census Round is a coordinated effort by CARICOM Member States and Associate Members to collect population and housing data using internationally recommended standards. Although the reference year is 2020/2021, data collection and publication schedules vary by country, partly due to the COVID-19 pandemic.
The census provides essential information on:
- Population size, structure, and distribution
- Housing characteristics
- Education, labour force, and migration trend
Quick Insights:

- Youngest Population: Belize (25 years)
- Total population size 397,484
- The median age of 25 indicates that half of the population is below 26 years, reflecting a predominantly youthful demographic structure.
- A low median age can also correlate with low life expectancy, reflecting broader health and social challenges.
- Oldest Population: Curacao (49 years)
- Total population size 155,826
- With a median age of 49, half of the population is above this age, signifying an ageing population.
- The proportion of people aged 65 and older is almost a quarter (24.7%) of the total population.
- Other Populations: Median Ages 33–44 Years
- This suggests a moderately mature population structure, with a substantial proportion of working-age adults relative to younger and older cohorts.
- This also suggests, balanced dependency ratios.
Using Census Data
Census data are best used for population counts, small-area analysis, and demographic profiles. Because census years differ across countries, users should exercise caution when making regional comparisons.
Country Census Results and Reports

Bahamas
![]() Males– 191,667
Males– 191,667
![]() Females– 206,498
Females– 206,498
![]()
![]() Total– 398,165
Total– 398,165
![]() Intercensal change– 13.3 %
Intercensal change– 13.3 %

Barbados
![]() Males– 130,037
Males– 130,037
![]() Females– 139,053
Females– 139,053
![]()
![]() Total– 269,090
Total– 269,090
![]() Intercensal change– 3%
Intercensal change– 3%
The Estimated Resident Population is derived from 2010 estimates, adjusted by births and deaths each year to 1st August 2021, and net migration

Belize
Tables: Census | Statistical Institute of Belize
![]() Males– 195,695
Males– 195,695
![]() Females– 201,789
Females– 201,789
![]()
![]() Total– 397,484
Total– 397,484
![]() Intercensal change– 23.3 %
Intercensal change– 23.3 %

Bermuda
![]() Males– 30,690
Males– 30,690
![]() Females– 33,089
Females– 33,089
![]()
![]() Total– 63,779
Total– 63,779
![]() Intercensal change– 1%
Intercensal change– 1%

Cayman Islands
![]() Males– 34,823
Males– 34,823
![]() Females– 33,927
Females– 33,927
![]()
![]() Total– 71,432*
Total– 71,432*
![]() Intercensal change– 29.2 %
Intercensal change– 29.2 %
* During the census of 2021, the gender of 61 individuals is not known. *
71432 is total estimated population

Curacao
See more: Publications Census 2023 | Senso Kòrsou
![]() Males– 70,162
Males– 70,162
![]() Females– 85,596
Females– 85,596
![]()
![]() Total– 155,826*
Total– 155,826*
![]() Intercensal change– 3 %
Intercensal change– 3 %
* During the census of 2023, the gender of 68 individuals is not known.

Grenada
![]() Males– 54,542
Males– 54,542
![]() Females– 54,479
Females– 54,479
![]()
![]() Total– 109,021
Total– 109,021
![]() Intercensal change– 2.2 %
Intercensal change– 2.2 %

Guyana
![]() Males– 440,882
Males– 440,882
![]() Females– 437,792
Females– 437,792
![]()
![]() Total– 878,674
Total– 878,674
![]() Intercensal change– 17.6 %
Intercensal change– 17.6 %

Jamaica
![]() Males–
Males–
![]() Females–
Females–
![]()
![]() Total– 2,774,538
Total– 2,774,538
![]() Intercensal change– 2.8 %
Intercensal change– 2.8 %

Montserrat
![]() Males– 2,189
Males– 2,189
![]() Females– 2,197
Females– 2,197
![]()
![]() Total– 4,386
Total– 4,386
![]() Intercensal change– 11%
Intercensal change– 11%

St. Kitts and Nevis
![]() Males– 25,000
Males– 25,000
![]() Females– 26,320
Females– 26,320
![]()
![]() Total– 51,320
Total– 51,320
![]() Intercensal change– 8.7 %
Intercensal change– 8.7 %

Saint Lucia
![]() Males– 84,714
Males– 84,714
![]() Females– 87,118
Females– 87,118
![]()
![]() Total– 171,832
Total– 171,832
![]() Intercensal change– 3.8 %
Intercensal change– 3.8 %

Dwelling Units per 1,000 Persons
Housing Availability in CARICOM Countries
Recent census data across 12 CARICOM countries shows significant variation in housing availability:
- High availability: Montserrat, Bermuda and Cayman Islands lead with over 430 dwelling units per 1,000 persons.
- Moderate availability: Curacao, Saint Lucia, Grenada and Bahamas have between 360–386 units per 1,000 persons.
- Lower availability: Guyana, Barbados, Belize and Jamaica have fewer than 335 units per 1,000 persons.
CARICOM Population & Housing Census Snapshot-Selected Countries
| COUNTRY | CENSUS YEAR | TOTAL POPULATION | SEX RATIO1 | TOTAL DEPENDENCY RATIO2 | MEDIAN AGE3 | DWELLING UNITS |
|---|---|---|---|---|---|---|
| Bahamas | 2021 | 398,165 | 92.8 | 54 | 33 | 144,128 |
| Barbados | 2021 | 269,090 | 93.5 | 52 | 42.5 | 73,571 |
| Belize | 2022 | 397,484 | 97.0 | 49.8 | 25.7 | 110,718 |
| Bermuda | 2016 | 63,779 | 92.7 | 46 | 44 | 28,192 |
| Cayman Islands | 2021 | 71,432 | 102.6 | 31.5 | 38 | 29,699 |
| Curacao | 2023 | 155,826 | 82.0 | 45.9 | 49 | 60,075 |
| Grenada | 2022 | 109,021 | 100.1 | 53.7 | 34.7 | 40,990 |
| Guyana | 2022 | 878,674 | 100.7 | 218,019 | ||
| Jamaica | 2022 | 2,774,538 | 926,815 | |||
| Montserrat | 2023 | 4,386 | 99.6 | 56.3 | 43.5 | 2,252 |
| St. Kitts and Nevis | 2021 | 51,320 | 95.0 | 40.5 | 34 | 21,677 |
| Saint Lucia | 2022 | 171,832 | 97.2 | 44.5 | 36.8 | 65,951 |
- Sex Ratio Indicator- males per 100 females ↩︎
- A low dependency ratio indicates a healthy economy where a sufficient number of working-age individuals can support the dependent population, typically those aged 0-14 and over 65. ↩︎
- The median age of a population is the age at which half the population is older and half is younger ↩︎
Highlights
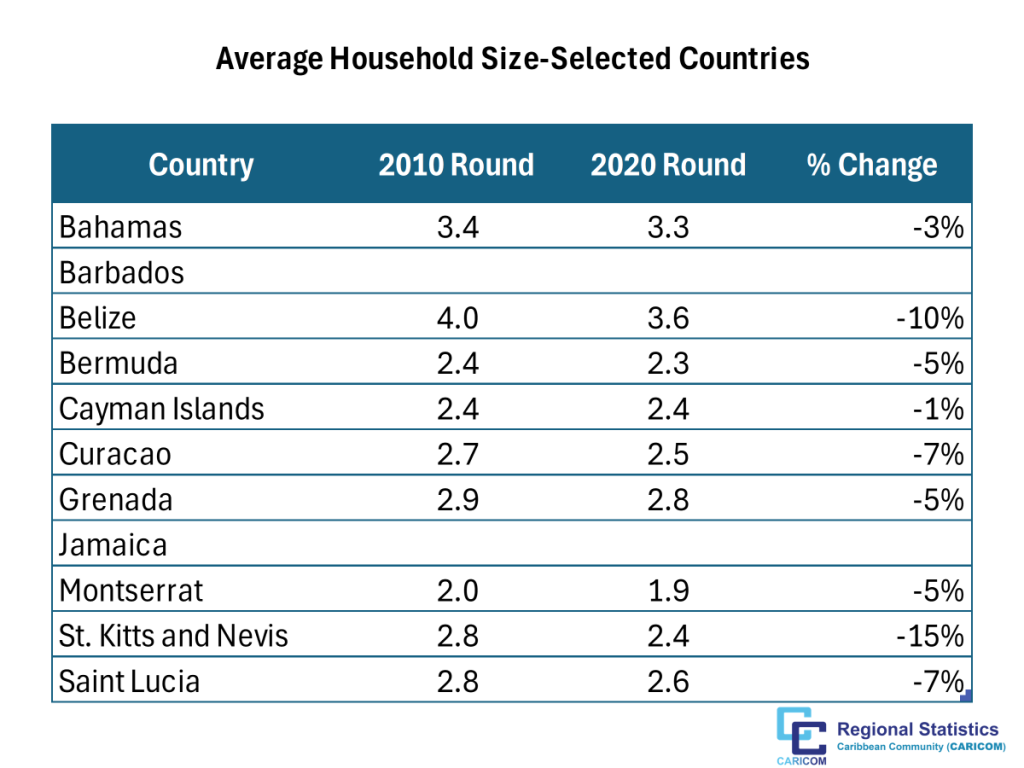
The available census data for selected CARICOM countries indicates a general decline in average household size between the 2010 and 2020 census rounds.
Several countries showed moderate declines ranging between 5% and 7%.
St. Kitts and Nevis experienced the most pronounced decrease (–15%), from 2.8 to 2.4 persons per household, while Bahamas recorded a small decline of –3% and Cayman Islands remained essentially stable, with only a –1% change.
Several CARICOM countries postponed enumeration due to COVID-19, leading to variation in census years and publication timelines. This page is regularly updated to reflect the latest available data.
Last updated: January 2026